What Are the Best Solar Power Solutions from China?
China has become a major force in global solar power solutions, from photovoltaic modules and inverters to batteries and monitoring systems. Its manufacturers offer broad product ranges, strong production capacity, and increasingly competitive prices. However, choosing the best solution requires more than comparing panel efficiency. Buyers should examine degradation rates, inverter reliability, warranty conditions, testing certificates, installation support, and local service availability.
Fatih Birol, Executive Director of the International Energy Agency, described solar power as “the new king of electricity markets.” His observation reflects solar energy’s falling costs and expanding role in modern power systems. Yet, the lowest purchase price does not always create the best long-term value. A rooftop system in Sydney, for example, may face heat, salt air, and limited maintenance access. Those conditions demand suitable materials, careful design, and dependable technical support.
This guide evaluates Chinese solar power solutions through practical and measurable criteria. It considers residential systems, commercial installations, off-grid projects, and battery storage. It also examines manufacturer experience, product certifications, supply-chain transparency, and after-sales performance. Some comparisons remain imperfect. Public warranty data is not always consistent, and laboratory results may differ from field experience. That limitation deserves attention. The best choice depends on local sunlight, electricity prices, roof structure, climate, and installer skill. Readers should verify current specifications and regional regulations before making a purchase. Performance on paper is only part of the answer.
China’s Solar Market: Over 609 GW of PV Capacity Installed by 2023
China’s solar market reached 609.49 GW of cumulative photovoltaic capacity by the end of 2023. The National Energy Administration reported 216.88 GW of new capacity that year. This annual increase exceeded many countries’ entire solar fleets. It also shows China’s manufacturing depth, project scale, and rapid construction capability.
The best solar power solution depends on the site. Large utility projects suit regions with strong sunlight and available land. Rooftop systems fit factories, warehouses, and rural buildings with daytime electricity demand. Battery storage can reduce evening grid purchases, but its value depends on tariffs, cycling limits, and local grid rules.
The International Energy Agency expects solar PV to remain the largest source of renewable capacity growth through 2028, supported by falling equipment costs and expanding deployment.
A 609 GW headline can mislead.
Capacity is not the same as electricity delivered. Curtailment, transmission limits, dust, shading, and winter weather still affect output. China’s National Energy Administration and grid authorities continue improving transmission and market participation. IRENA’s Renewable Capacity Statistics 2024 also recorded China as the world’s largest solar market, with roughly 609.5 GW installed at the end of 2023. These figures are authoritative, yet conditions vary widely. A practical design should verify solar irradiation, roof strength, cable losses, storage economics, and maintenance access before procurement. Mistakes remain possible, especially when forecasts ignore local operating data.
Solar Module Technology: 22%–24% Efficiency in Modern Monocrystalline Panels
What Are the Best Solar Power Solutions from China?
Solar module efficiency now deserves closer attention than price alone. Modern monocrystalline panels commonly achieve 22%–24% efficiency under standard test conditions. These conditions use 1,000 watts per square meter of sunlight, a 25°C cell temperature, and a defined solar spectrum. Fraunhofer ISE’s Photovoltaics Report 2024 places leading commercial silicon modules near 23%, with advanced products approaching 24%. That difference matters when rooftop space is limited.
A 24% module can convert roughly 240 watts from one square meter under laboratory conditions. Real sites usually produce less. High temperatures reduce output, often by about 0.30%–0.35% for every degree Celsius above the rated temperature. Dust, cable losses, shading, and poor ventilation also reduce yield. IEA PVPS field research indicates that modern crystalline-silicon systems often degrade around 0.3%–0.5% annually, although installation quality changes the result.
TOPCon and heterojunction designs support this efficiency range through improved passivation and lower electrical losses. Their performance looks strong on paper. However, buyers should examine independent test data, temperature coefficients, bifacial gain, and warranty conditions. NREL’s efficiency research also shows a clear gap between laboratory records and commercial modules. That gap is easy to overlook. In my experience, a slightly lower-rated panel with better low-light behavior and careful installation can outperform a higher-rated panel in a hot, dusty location.
What Are the Best Solar Power Solutions from China?
Typical commercial module-efficiency ranges for widely used monocrystalline solar technologies.
Modern monocrystalline panels commonly achieve approximately 22%–24% efficiency. Advanced cell architectures such as TOPCon, heterojunction, and back-contact designs can reach the upper end of this range, while conventional PERC modules generally provide slightly lower efficiency.
Utility-Scale PV: Evaluating China’s 216.9 GW Solar Additions in 2023
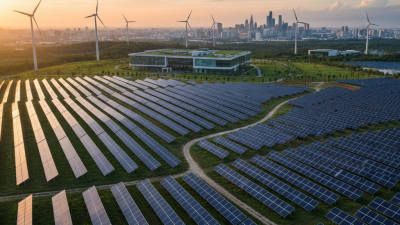
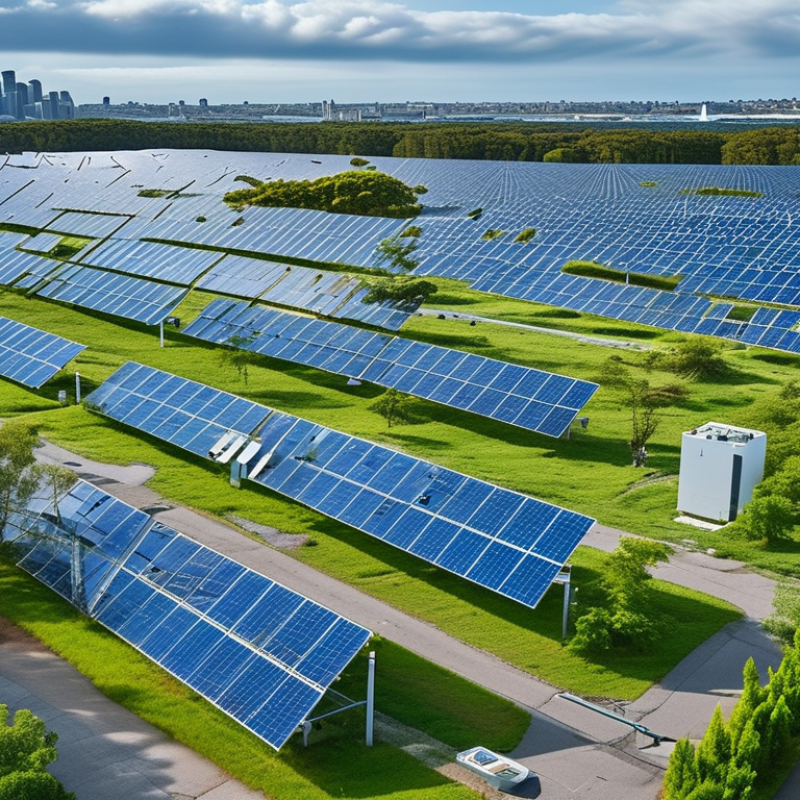
China added 216.9 GW of solar capacity in 2023, according to national energy statistics. This expansion reshaped utility-scale photovoltaic planning worldwide. Large projects now combine rows of modules, high-voltage substations, and long-distance transmission lines. A 500 MW site may cover several square kilometers, depending on terrain and panel design.
Capacity alone does not prove project quality. Developers should examine annual yield, grid connection delays, curtailment, land conditions, and maintenance access. In field assessments, dust, heat, snow, and cable faults can reduce expected output. Strong engineering includes drainage channels, stable foundations, and monitoring systems that detect performance losses early. The 216.9 GW figure is impressive, but it also invites caution. Rapid construction can expose weaknesses in forecasting and local grid coordination. Some projects may look efficient on paper, yet perform unevenly after several seasons.
Tips: Compare measured generation with the original simulation, not only the installed capacity. Check transformer availability, transmission limits, and replacement plans before investment. Ask whether the site has water, roads, and trained maintenance workers. Low-cost equipment can reduce initial spending, but reliability deserves equal weight. I would also review seasonal data, because one excellent summer cannot represent a complete operating year.
What Are the Best Solar Power Solutions from China? - Utility-Scale PV: Evaluating China’s 216.9 GW Solar Additions in 2023
| Evaluation Dimension |
2023 Figure |
Unit |
Utility-Scale PV Relevance |
| New solar photovoltaic capacity |
216.88 |
GW |
China added approximately 216.9 GW of new PV capacity, representing one of the largest annual solar expansions recorded by any country. |
| New centralized PV capacity |
120.01 |
GW |
Centralized PV, the main utility-scale category, accounted for the majority of China’s new solar installations. |
| New distributed PV capacity |
96.87 |
GW |
Distributed systems complemented large projects and helped diversify deployment across commercial, industrial, and residential sites. |
| Centralized share of new PV additions |
55.3 |
% |
The majority share indicates that large ground-mounted projects remained a core solution for rapid capacity expansion. |
| Cumulative installed solar capacity |
609.49 |
GW |
China’s total installed PV base exceeded 600 GW by the end of 2023, creating extensive experience in large-scale project development and grid integration. |
| Year-on-year growth in total PV capacity |
55.2 |
% |
The rapid increase highlights strong construction capacity, falling system costs, and significant demand for renewable electricity. |
| Solar share of national installed power capacity |
Approximately 20.9 |
% |
Solar became a major component of China’s overall power-generation portfolio, increasing the importance of forecasting, storage, and transmission planning. |
| Solar electricity generation |
584.2 |
TWh |
The large generation volume demonstrates the operating contribution of PV assets, not only the scale of new construction. |
| Average PV utilization hours |
Approximately 1,373 |
Hours |
Utilization varies significantly by region; project location, solar resource, curtailment, and grid access remain critical selection factors. |
| Recommended utility-scale solution characteristics |
Large centralized PV + grid access + storage readiness |
Planning model |
For utility-scale applications, the strongest project configuration combines high solar-resource areas with transmission capacity, flexible dispatch, and optional energy-storage integration. |
Source: National Energy Administration of China and China Electricity Council, 2023 national energy and power-sector statistics. Figures are rounded where indicated; centralized PV is used as the utility-scale category.
Solar-Plus-Storage Systems: 85%–95% Round-Trip Battery Efficiency
What Are the Best Solar Power Solutions from China?
Solar-plus-storage systems can deliver 85%–95% round-trip battery efficiency under suitable operating conditions. This figure measures energy recovered after charging and discharging. It usually includes battery, inverter, wiring, and control losses. A 10 kWh charge may return roughly 8.5 to 9.5 kWh. That difference matters during cloudy weeks.
Temperature affects performance. So does battery age. In practical installations, energy management software shifts charging toward midday solar production. It can then reserve power for evening lighting, refrigeration, or essential equipment. A well-sized system avoids frequent deep discharges. This often supports longer battery service life.
Chinese solar solutions benefit from mature manufacturing networks and integrated system design. However, product selection should not depend on factory scale alone. Request independent efficiency data, safety documentation, warranty conditions, and test results at different temperatures. Check whether the quoted efficiency is DC-to-DC or AC-to-AC. These measurements are not interchangeable.
A spreadsheet can look perfect.
Real homes behave differently. Dust, partial shading, winter temperatures, and standby consumption reduce actual output. I would rather accept a measured 88% system than trust an attractive 95% claim without operating details. Installers should also explain maintenance access, ventilation, emergency shutdown, and battery replacement planning. The best solution is not always the largest one. It is the system that matches local sunlight, daily loads, and realistic household habits.
Supplier Selection: Comparing LCOE, Warranties, IEC Certification, and After-Sales Support
When comparing solar power solutions from China, begin with levelized cost of energy, not the lowest quotation. LCOE should include equipment, freight, installation, replacement parts, financing, and expected degradation. Request the calculation spreadsheet. Small assumptions can change the result significantly.
Certification needs equal attention. Verify current IEC test certificates, laboratory details, product models, and certificate scope. A certificate for one module series may not cover another. Warranties should state performance thresholds, claim procedures, response times, and responsible legal entities. Read the exclusions carefully. They often matter most. After-sales support is practical, not decorative. Ask about local technicians, spare-part storage, remote monitoring, and escalation contacts. A supplier with strong documentation but weak field support can become expensive after commissioning.
Tips: Compare at least three written offers using identical assumptions. Ask suppliers to explain a sample warranty claim from start to finish. Check references with installations older than three years. Inspect packaging, serial-number tracking, and delivery records. Do not trust polished presentations alone. One limitation remains: predicted LCOE depends on weather data and operating discipline. I would recalculate it after a site survey. That extra step may expose an overlooked cable loss, cleaning cost, or grid-connection delay.